


Flood
In the Bay Area, winter storms and sea-level rise represent significant flood risks. The following mapping resources indicate regulatory zones around flood hazard, and reflect some of the latest research in the rapidly growing field of climate-related flood risk.
Flood Risk
Flooding associated with severe storms has been among the most common hazards in the Bay Area during the period from 1950 to 2015, occurring nearly annually. Often-heavy rainfall brings many areas of localized flooding, especially in low lying areas. Flood hazards include:
- Riverine, or overbank, flooding associated with floodplains, ranging from narrow, confined channels in the steep valleys of mountainous and hilly regions to wide, flat areas in valley and coastal regions;
- Nuisance flooding caused by heavy precipitation/storm water in flat, low-lying, urbanized areas, resulting in inundation of basements, low-lying roads, and parking lots from street drainage;
- Coastal flooding associated with Pacific Ocean storms;
- Sea level rise.
Floods are a significant cause of death, injury and property loss in the United States annually.
Flood
In response to increasing losses from flood hazards nationwide, the National Flood Insurance Program (NFIP) was established. The 1968 Act provided for the availability of flood insurance within communities that were willing to adopt floodplain management programs to mitigate future flood losses. The act also required the identification of all floodplain areas within the United States and the establishment of flood-risk zones within those areas. Use the Glossary of Flood Hazard Terms.
FEMA Flood Hazard Zones

A regulatory resource based on historic data about regional flooding, FEMA flood maps are used for risk assessments and flood insurance. The map includes the 100 and 500 year floodplains as designated by FEMA, as well as potential floodplains currently protected by levees. To view FEMA flood hazard information, select “FEMA Flood Hazard” in the Hazard Viewer.
Sea Level Rise
Globally, sea levels are rising due to thermal expansion caused by the ocean warming and the melting of land-based ice such as glaciers and polar ice caps. Regionally and locally, sea level rise has the potential to influence the impact of coastal, riverine and localized nuisance flooding, resulting in:
- Permanent iInundation
- More frequent, extensive and longer-duration floods
- Shoreline erosion and overtopping
- Elevated groundwater and increased salinity intrusion
ART Bay Shoreline Flood Explorer
The Bay Conservation DC Adapting to Rising Tides program Bay Shoreline Flood Explorer and associated analyses provide a regional-scale illustration of Bay shoreline flooding due to specific sea level rise and storm surge scenarios. These resources are intended to improve sea level rise awareness and preparedness. The BCDC resource focuses on flooding inside the San Francisco Bay and does not include the Pacific coast west of the Golden Gate Bridge.
East Contra Costa Shoreline Flood Explorer
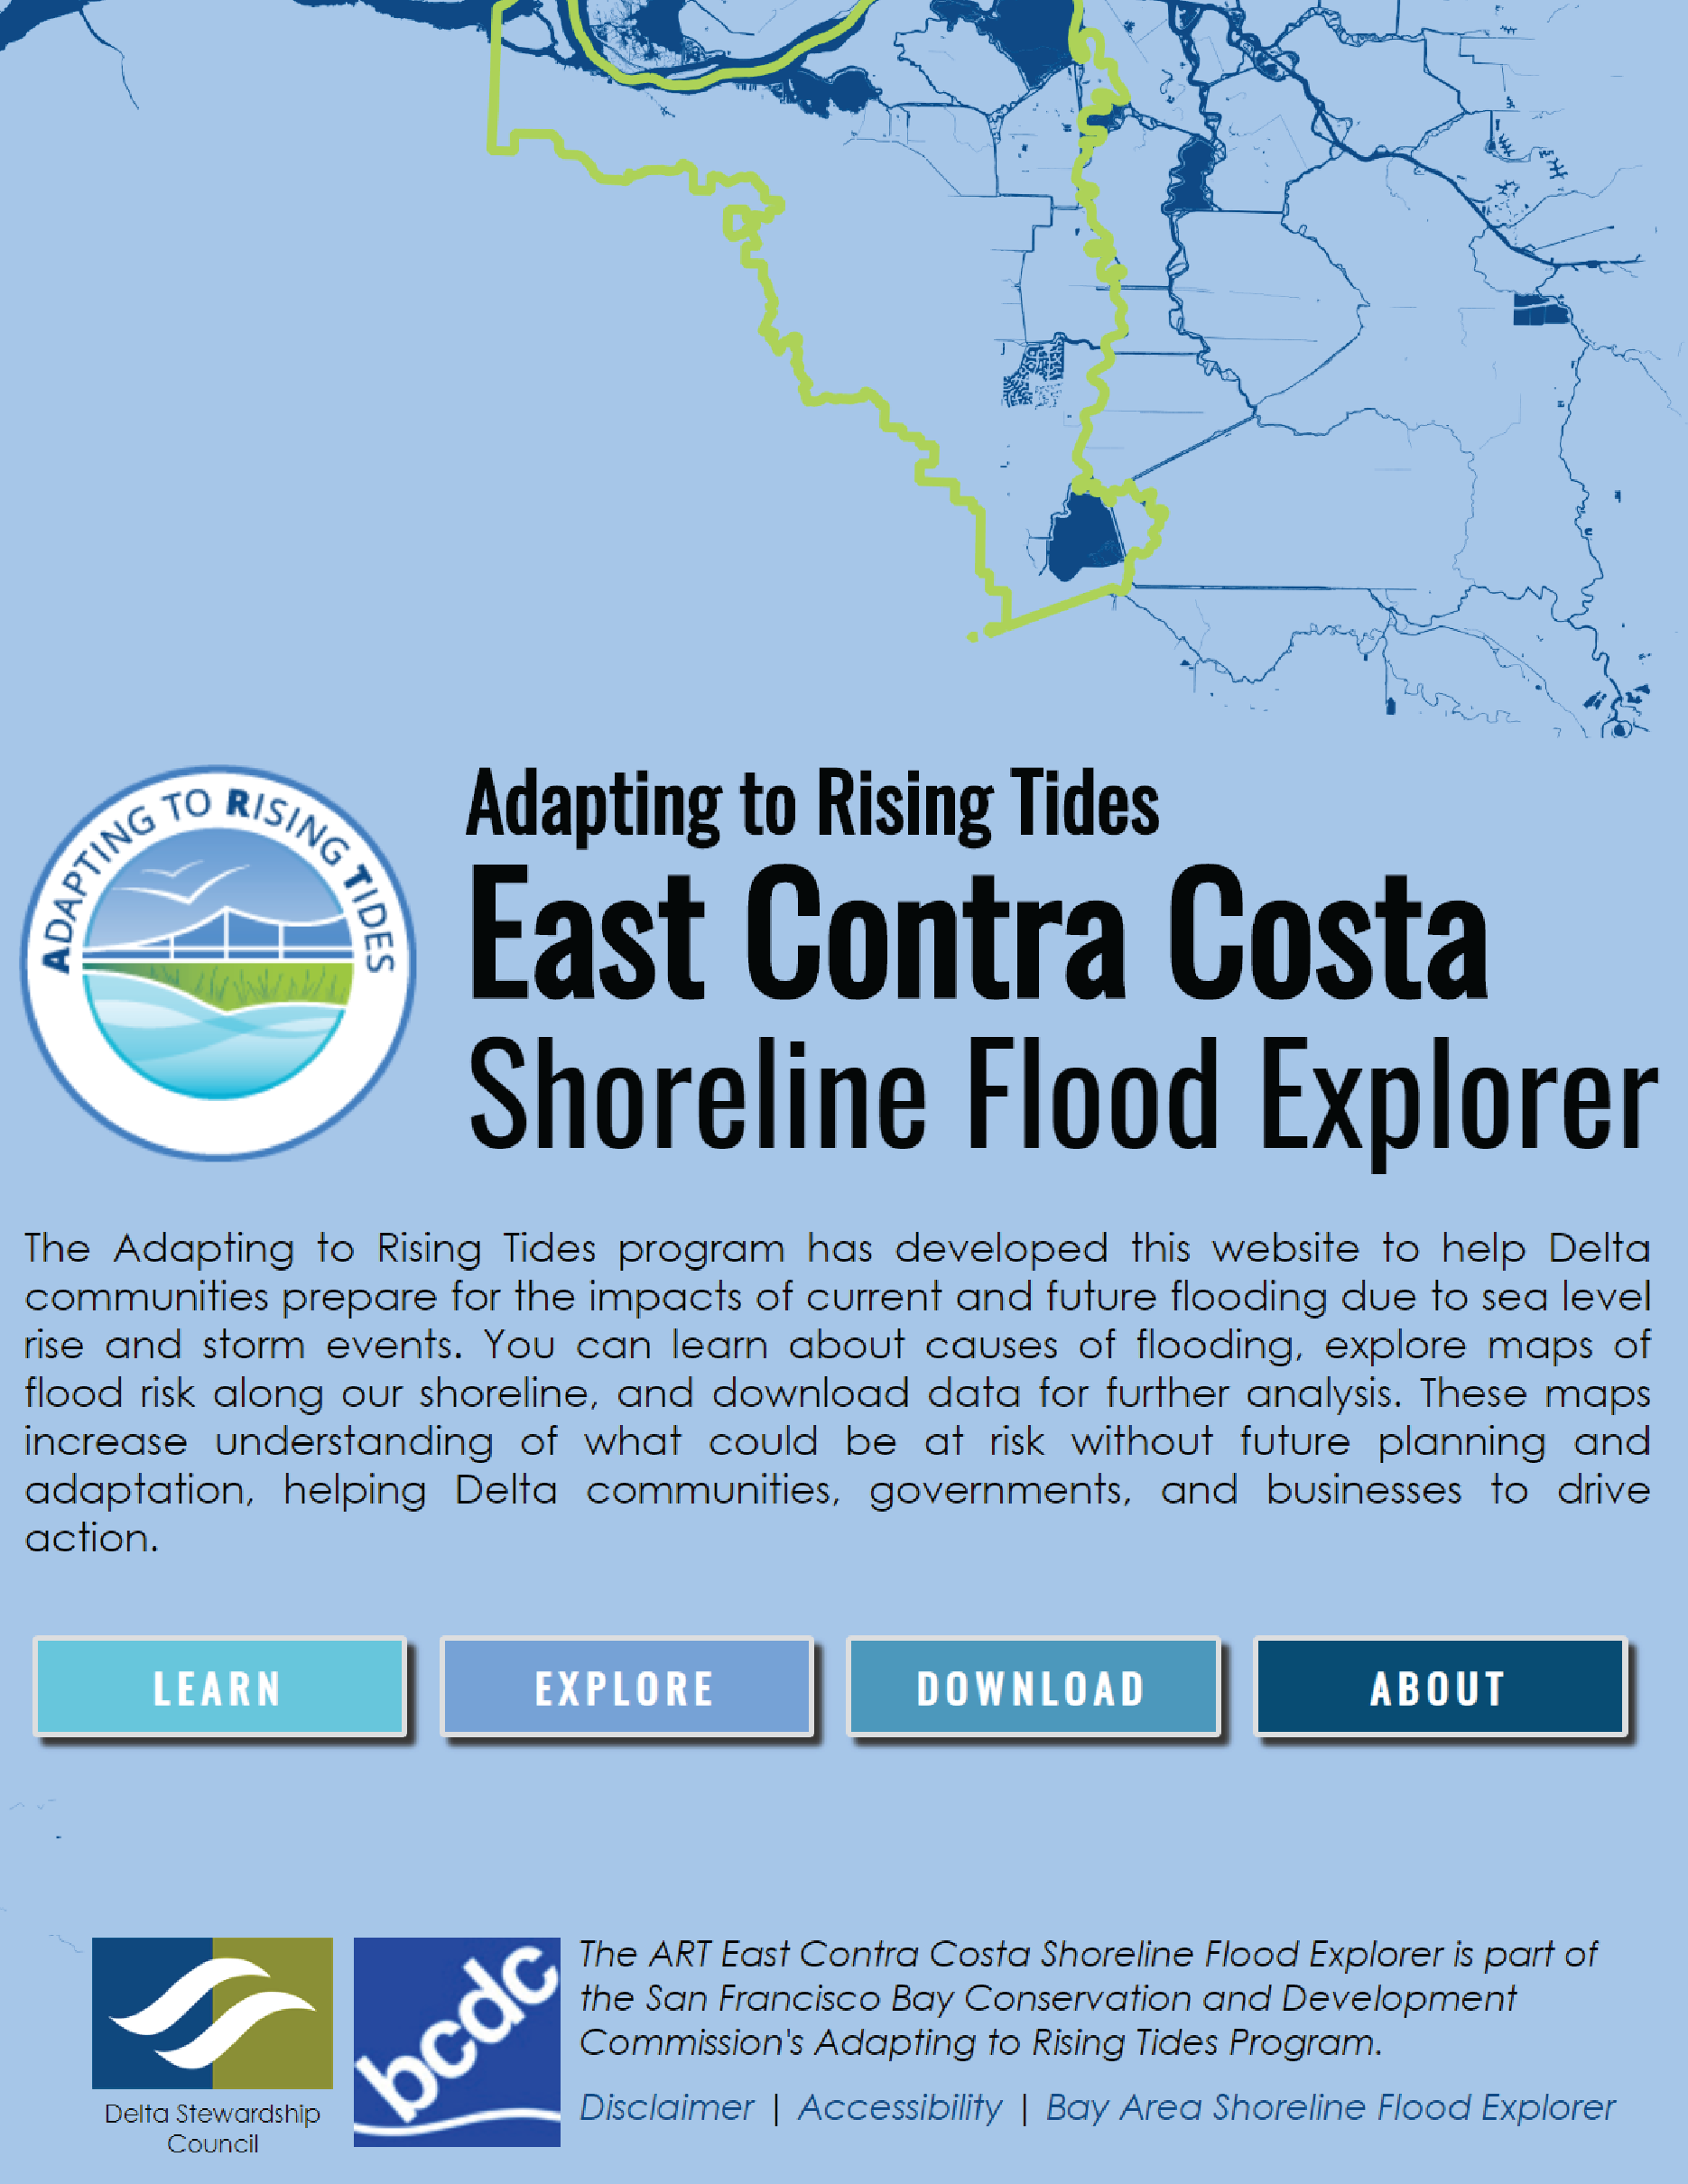
This resource helps Delta communities prepare for the impacts of current and future flooding due to sea level rise and storm events. Learn about causes of flooding, explore maps of flood risk along our shoreline, and download data for further analysis. These maps increase understanding of what could be at risk without future planning and adaptation, helping Delta communities, governments and businesses to drive action. Launch ECC Flood Explorer.
Sea Level Rise Viewer

The NOAA viewer provides sea level rise and potential coastal flooding impact areas and relative depth for areas along the Pacific coast. Launch Sea Level Rise Viewer.
Groundwater
The relationship between groundwater and flooding, as well as groundwater and sea level rise, is currently uncertain, but is a fertile area for current research. Flood research is rapidly evolving as the scientific community grapples with the challenges of groundwater, increased precipitation and rising seas. This space will be updated as more data and resources become available.
