Racial Diversity
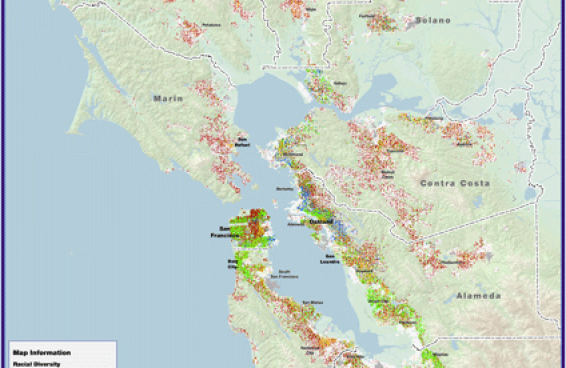
This map illustrates the racial diversity of neighborhoods in the San Francisco Bay Area in 2000. Each dot represents 100 people in four race categories: white (non-Hispanic), black (non-Hispanic)...
These custom-crafted maps are developed by ABAG and MTC’s mapmakers who turn data into art to tell compelling stories about important trends in the Bay Area, across the nation and around the world.
This map illustrates the racial diversity of neighborhoods in the San Francisco Bay Area in 2000. Each dot represents 100 people in four race categories: white (non-Hispanic), black (non-Hispanic)...
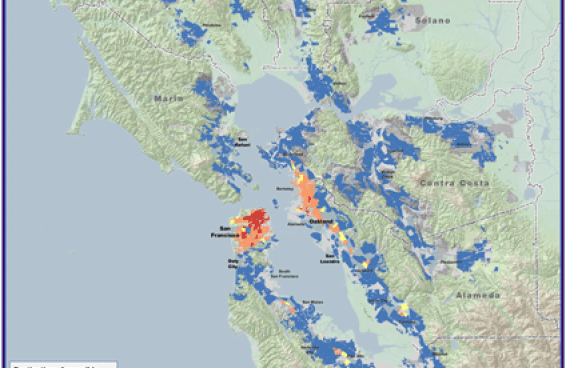
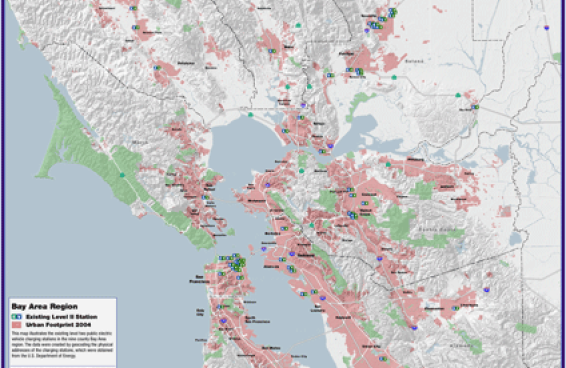
The map of the month illustrates the existing Level II public vehicle charging station infrastructure in the nine county Bay Area region. The data was created by geocoding the address of the 91...
The map of the month shows the number of Essential Destinations (Schools, Food Stores, Health Services, Social Services, Banks, and Places of Worship) accessible from Bay Area locations within a 30...
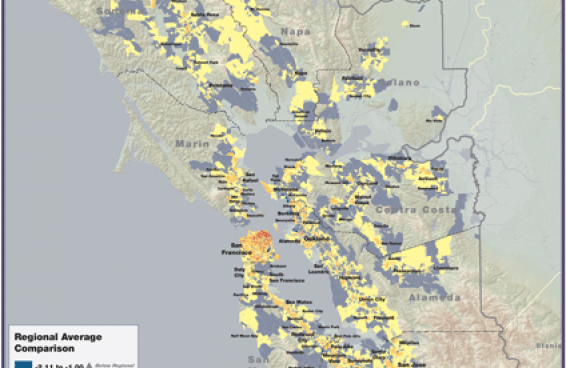
The map of the month shows a transportation availability index which is comprised of measures of auto availability in 2000, transit service frequency in 2009, and walkability in 2006. Standard scores...
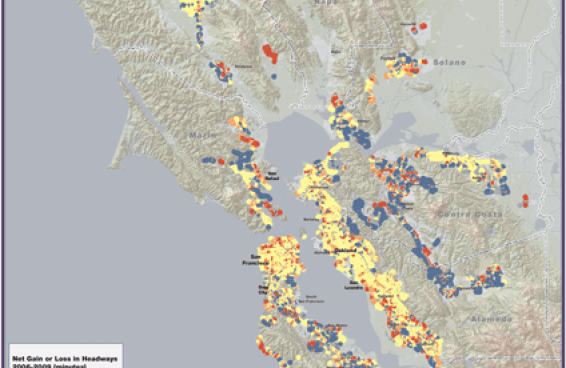
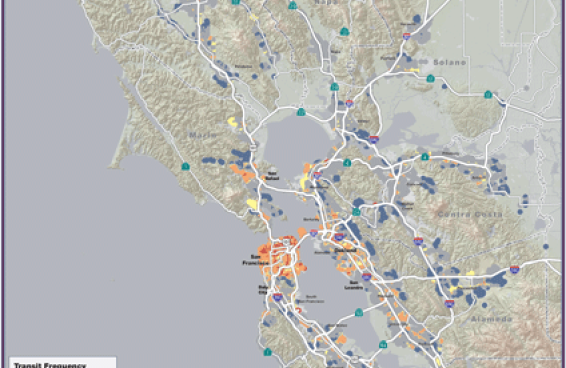
The map of the month shows recession-related changes in frequency, or headways, for daily bus, rail and ferry service between 2006 and 2009. The blue areas indicate service reductions (headways...
The map of the month shows the overall walkability of the Bay Area based on proximity to points of interest (POIs). POI categories considered for the analysis included educational institutions and...
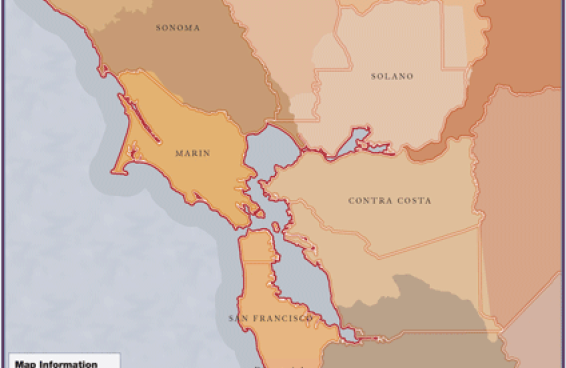
The map of the month shows the historical boundaries of the Bay Area counties. On January 4, 1850, the California constitutional committee recommended the formation of 18 counties. They were Benicia...
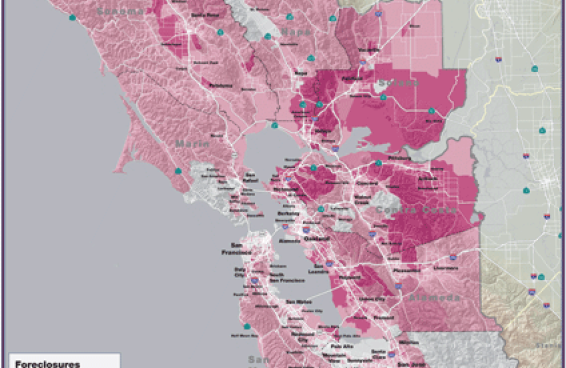
The map of the month shows the total owner-occupied foreclosures within the Bay Area by census tract between July 2008 and June 2009. Foreclosure types considered for this analysis include lender...
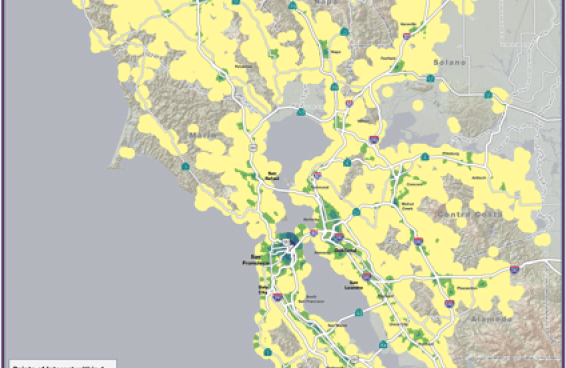
The map of the month shows the weekday transit service frequency within the Bay Area urban footprint. The transit service frequency was generated based on the rail, ferry and bus service data in MTC's...