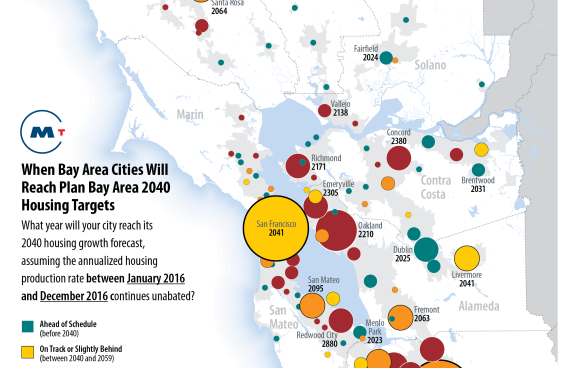
Map of the Month

These custom-crafted maps are developed by ABAG and MTC’s mapmakers who turn data into art to tell compelling stories about important trends in the Bay Area, across the nation and around the world.

May, 2017

Northern California Mega Region Employment Density

This month's Map of the Month highlights employment centers within the 21 - County Northern California Mega Region. Employment Centers were defined within built-up areas where there was an employment...

April, 2017

Northern California Mega Region Employment Density

A recent New York Times article examines one of the biggest drivers in a families' decision to leave cities: school. Using data from a number of sources, the New York Times developed charts that look...

March, 2017

Traffic Incident Management Along Bay Area Freeways

In December 2016, Waze and MTC entered into a data sharing agreement that provides the Freeway Service Patrol (FSP) program with real-time information that will help FSP tow drivers quickly detect...

February, 2017

Most Congested Urban Areas In The U.S.

This month's map highlights a recent study released by Inrix Inc. that examines traffic congestion in over 1,000 cities - 240 in the U.S. - across 38 countries. The study reveals that the U.S. is...

December, 2016

2016 Presidential Election - Country Results

These maps provide three different views of the recent presidential election. The first map shows county-by-county results in the traditional red and blue colors. From a transportation perspective...

November, 2016

Growing Movement Toward State And Local "Self Help"

This month's map shows the growing movement towards state and local “self help” in the funding of transportation infrastructure throughout the United States. According to the Eno Transportation...

October, 2016

Megaregion Early Commute

This month's map is focused on the early-bird commute for workers living in the Northern California Megaregion. This region is home to approximately 12 million residents and 5 million commuters, of...