

These custom-crafted maps are developed by ABAG and MTC’s mapmakers who turn data into art to tell compelling stories about important trends in the Bay Area, across the nation and around the world.
October, 2010
Racial Diversity
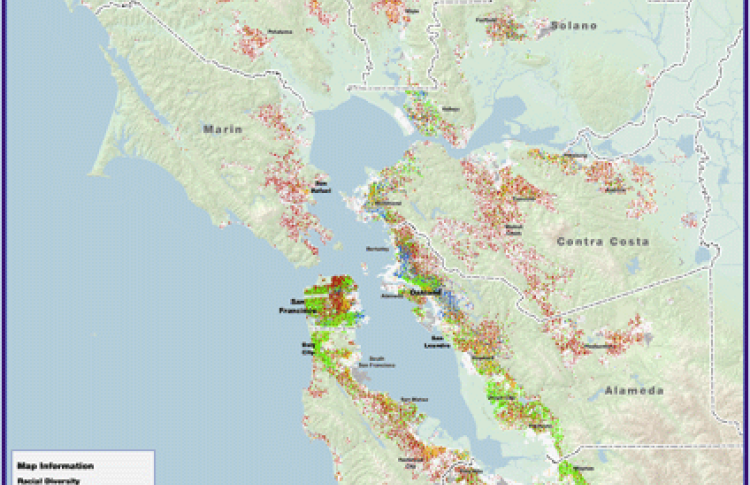
This map illustrates the racial diversity of neighborhoods in the San Francisco Bay Area in 2000. Each dot represents 100 people in four race categories: white (non-Hispanic), black (non-Hispanic), Hispanic/Latino, and Asian/Pacific Islander. Thus, the map also depicts population densities throughout the region. While the rural/ suburban areas in the region have largely white populations, many urban/ densely populated areas in the region are racially diverse, with two or more ethnicities living in relatively non-segregated neighborhoods.