These custom-crafted maps are developed by ABAG and MTC’s mapmakers who turn data into art to tell compelling stories about important trends in the Bay Area, across the nation and around the world.

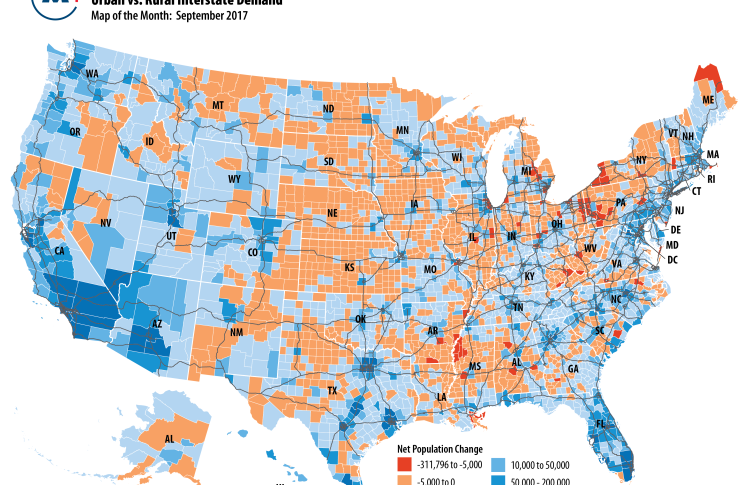
Population Growth Variation Across U.S. Counties
Since the turn of the century, the U.S. has undergone a redistribution of population from rural and rust belt counties to urban counties; particularly those along the Northern and Southern Atlantic Seaboard, the Pacific Coast and parts of the Southwest region. 41 percent or 1,295 counties had population declines from 2000 Ì2016, with 15 counties experiencing declines of more than 25,000 people or 2.4 percent of the total population.Over the same period, total population for the nation grew by 42 million, 8 percent of which has migrated from declining rural and rust belt counties to growing urban counties along the East and West Coast, and in the Southwest, resulting in a 23 percent increase in population occurring in 60 percent of U.S. counties.The data indicates that the majority of this growth is occurring in just 12 percent of counties, including the Bay Area which has experienced a 2.4 percent increase in population.

