

These custom-crafted maps are developed by ABAG and MTC’s mapmakers who turn data into art to tell compelling stories about important trends in the Bay Area, across the nation and around the world.
December, 2010
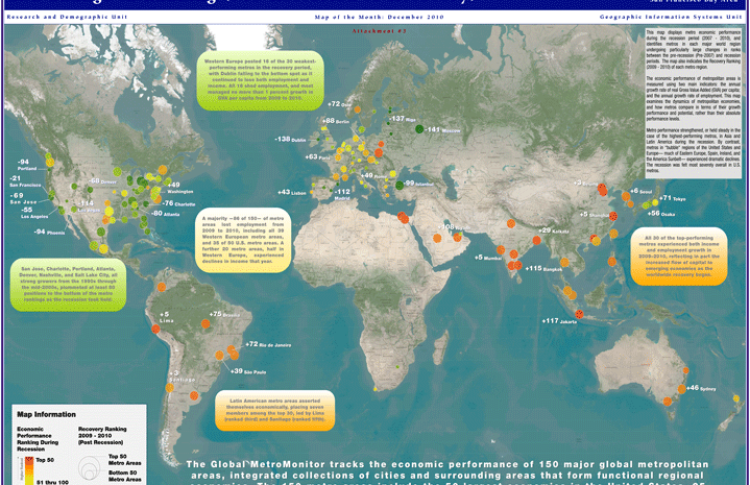
Metro Economic Performance During The Great Recession And Change In Ranking (Pre-Recession To Recovery)
The map of the month depicts some recent research conducted by the Brookings Institution and London School of Economics about how the world's 150 largest metropolitan economies have fared during the Great Recession. The map shows that the metro regions in the U.S. and Europe took the brunt of the economic downtown, while those in Asia and other developing countries weathered the storm in much better shape.