

These custom-crafted maps are developed by ABAG and MTC’s mapmakers who turn data into art to tell compelling stories about important trends in the Bay Area, across the nation and around the world.
February, 2011
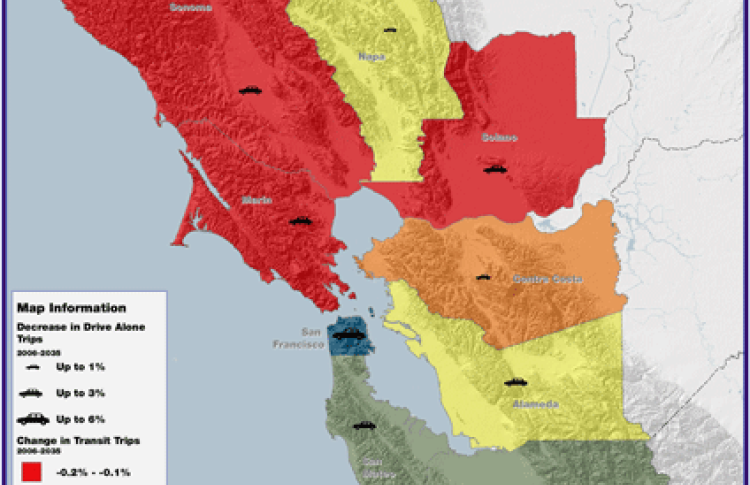
Change In Transportation Mode Use 2006-2035
This month's map shows the projected change in mode share for county to county home-based work trips in the Bay Area. The data are based on 2006 as the base year, and 2035 as the projection year. Most counties in the Bay Area show an increase in transit trips, accompanied by a general decrease in the number of drive alone trips. Santa Clara county shows an increase of up to 2% in transit trips with up to a 3% decrease in the number of drive alone trips. San Francisco county shows the most improvement in both categories.