

These custom-crafted maps are developed by ABAG and MTC’s mapmakers who turn data into art to tell compelling stories about important trends in the Bay Area, across the nation and around the world.
September, 2012
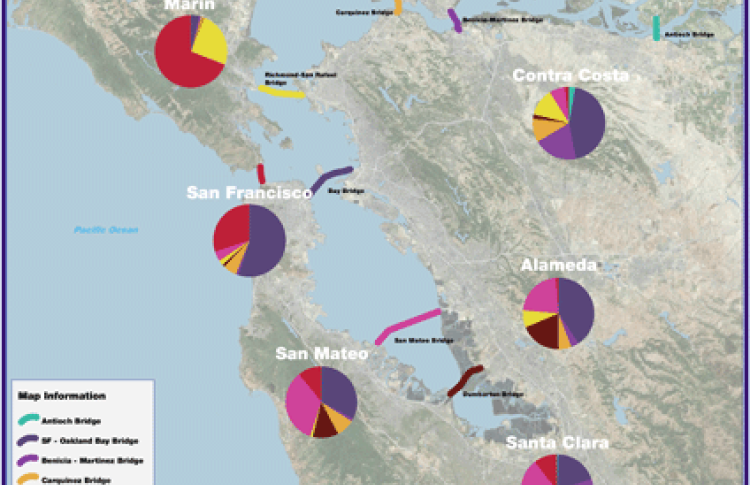
Share Of Fastrak Transactions In 2011 By County And Bridge
This map shows the distribution of FasTrak toll crossings generated by each county in the Bay Area. As expected, the distribution generally shows that counties closest to a bridge account for a greater share of FasTrak usage. However, some toll crossings – such as the Golden Gate and Bay Bridges – draw a significant share of users from distant counties. For instance, 32% of FasTrak customers from San Mateo County use the Bay Bridge, while 11% of both San Mateo and Santa Clara County customers use the Golden Gate Bridge.