

These custom-crafted maps are developed by ABAG and MTC’s mapmakers who turn data into art to tell compelling stories about important trends in the Bay Area, across the nation and around the world.
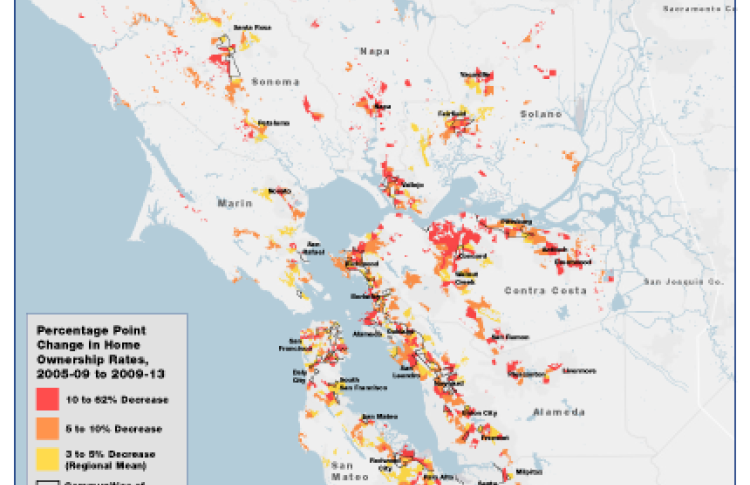
Negative Change In Homeownership Rates Between 2005-2009 And 2009-2013
Between 2005-2009 and 2009-2013, homeownership rates in the 9-county Bay Area decreased by about 2.8% overall. But the rates vary significantly across the region. The region's lower-income neighborhoods and its outer suburbs were most impacted by the foreclosure crisis and therefore experienced the sharpest drop in homeownership rates. These communities include, Oakland, Hayward and San Ramon. On average, in 2013, the Bay Area had fewer homeowners than in 2005. These households will likely not benefit as much from the recent recovery compared to households that were able to retain ownership of their homes during the Great Recession.