These custom-crafted maps are developed by ABAG and MTC’s mapmakers who turn data into art to tell compelling stories about important trends in the Bay Area, across the nation and around the world.

December, 2017
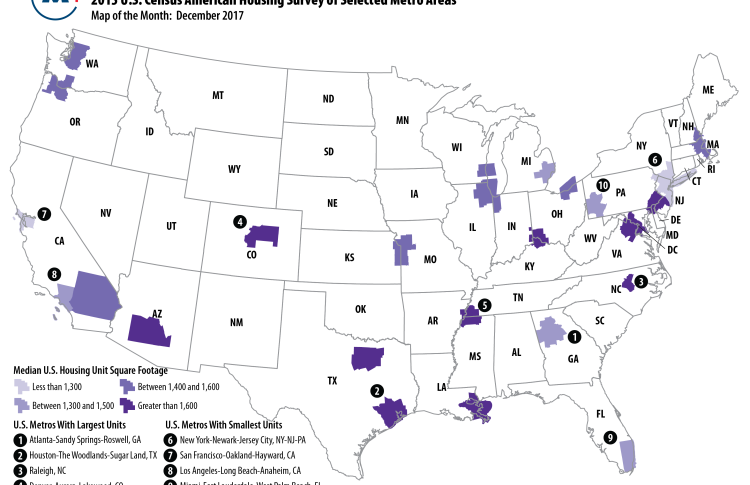
Median Square Footage Of Housing Units In Major U.S. Metro Areas
The month's Map of the Month examines an issue of housing policy not often discussed:how big are the houses that get built? The map depicts U.S metros with both the largest and smallest units. As you can see, the San Francisco-Oakland urbanized area is on the small end of the scale.

