

These custom-crafted maps are developed by ABAG and MTC’s mapmakers who turn data into art to tell compelling stories about important trends in the Bay Area, across the nation and around the world.
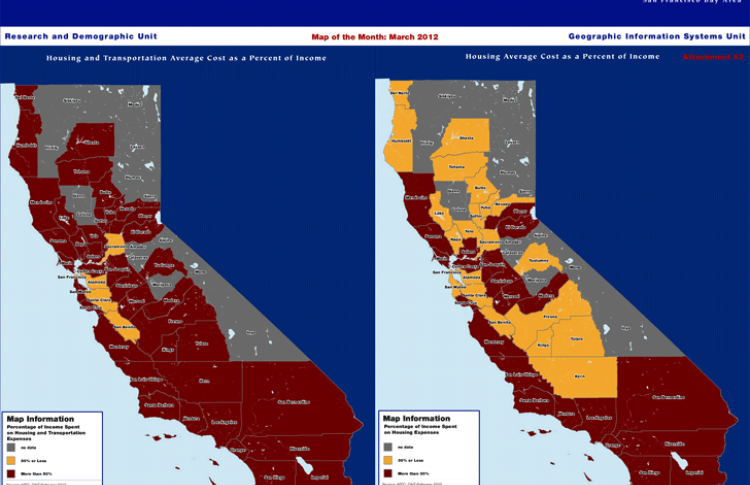
Housing And Transportation Costs In 2009
T he map shows the Center for Neighborhood Technology's Housing and Transportation (H+T) Affordability Index using 2009 American Community Survey Data. Compared side-by-side is the cost of housing as a percent of income (on the right) with the cost of housing and transportation as a percent of income (on the left) for an average household at the county level. The average housing cost of five Bay Area counties does not exceed 30% of average household income. When taking into consideration the added cost of transportation, however, only three Bay Area counties– Alameda, San Francisco, and Santa Clara- do not exceed the 50% threshold for combined cost.