These custom-crafted maps are developed by ABAG and MTC’s mapmakers who turn data into art to tell compelling stories about important trends in the Bay Area, across the nation and around the world.

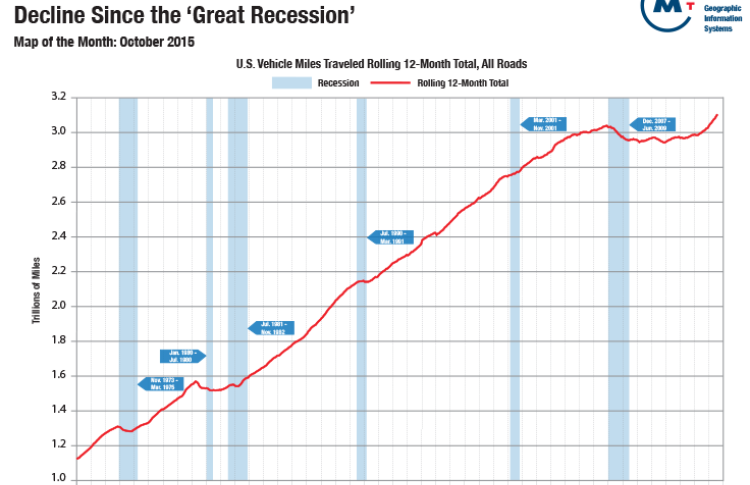
U.S. Vehicle Miles Traveled At All-Time High After Decline Since The "Great Recession"
This graph shows the historical rolling 12-month total vehicle miles traveled on all roads starting in 1971. Vehicle miles traveled increased 4.2% year-over-year in July 2015, continuing an upward trajectory that started in March 2014. This ended an unprecedented five-year period of flat rolling 12-month totals following the ‘Great Recession’ of December 2007-June 2009. Cheaper gasoline prices likely account for some of the increase, with the national average per gallon declining from $3.69 in July 2014 to $2.88 in July 2015. The rebound of the national economy, increased job growth, and expanding population are additional factors.

