These custom-crafted maps are developed by ABAG and MTC’s mapmakers who turn data into art to tell compelling stories about important trends in the Bay Area, across the nation and around the world.

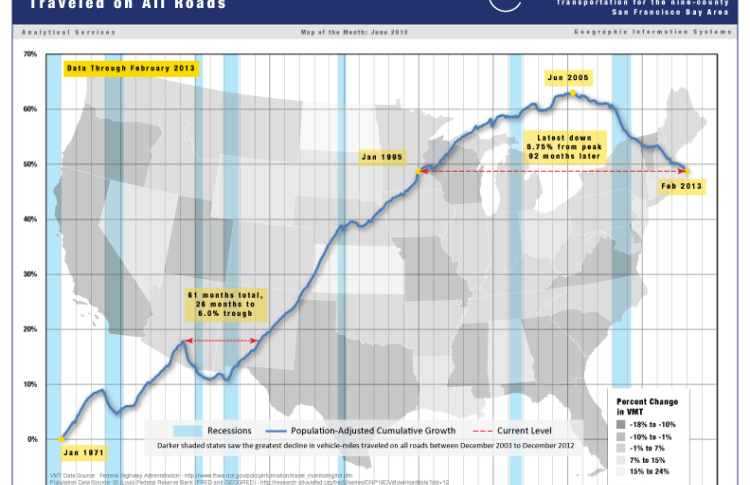
Estimated Vehicle Miles Traveled On All Roads
This map and chart illustrates total vehicle miles traveled on all roads across the country. The data is based upon traffic volume trends data collected by the U.S. D.O.T data from January 1971 to February 2013. Since June 2005, vehicle miles driven have fallen 8.75 percent. This decline has remained steady for the past 92 months. There are several reasons that may be causing this steady downward trend. It has been suggested that due to rising gas prices, the Great Recession, an aging population led by the Baby Boom generation which is comprised of Americans over the age of 55 who tend to drive less, and quite possibly younger Americans choosing to drive less. Between 2001 and 2009, the average yearly number of miles driven by 16- to 34-year-olds has dropped 23 percent.Researchers indicate that this trend may be linked to five principal factors:The cost of Driving has increasedThe recent recessionIt is harder to get a license in many statesMore younger people are choosing to live in transit-oriented areas andTechnology is making it easier to go car-freeData Source Information:Traffic Volume Trends is a monthly report based on hourly traffic count data reported by the States. These data are collected at approximately 4,000 continuous traffic counting locations nationwide and are used to estimate the percent change in traffic for the current month compared with the same month in the previous year. Estimates are re-adjusted annually to match the vehicle miles of travel from the Highway Performance Monitoring System and are continually updated with additional data.

