These custom-crafted maps are developed by ABAG and MTC’s mapmakers who turn data into art to tell compelling stories about important trends in the Bay Area, across the nation and around the world.

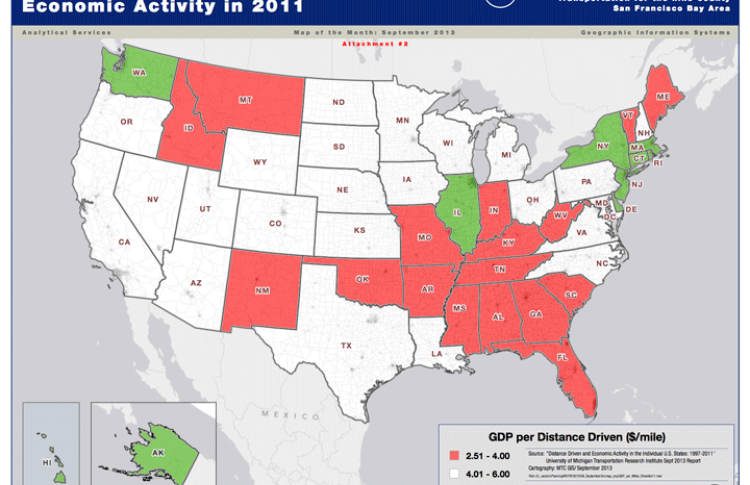
Distance Driven And Economic Activity In 2011
From the 1930s to 2003, there was a high correlation between miles driven and state GDP. The greater the number of miles driven the higher the state GDP. Starting in 2003, these two parameters began to diverge, due to a lack of growth in the amount of miles being driven. This map shows the relationship between total vehicle miles driven and GDP per state in 2011. According to the recent report "Distance Driven and Economic Activity in the Individual U.S. States: 1997-2011," done by the University of Michigan Transportation Research Institute, the District of Columbia had the highest GDP per distance driven ($30.04/mile), followed by Alaska ($11.16/mile), and New York ($9.16/mile). Among the lowest states were Mississippi ($2.51/mile), Alabama ($2.75/mile), and New Mexico ($3.12/mile). The study also found that higher density populations correlated to a higher GDP/mile ratio, which is expected. But it rather unexpectedly found that states with large land areas correlated to a high level of GDP/mile ratio.

