

January, 2010
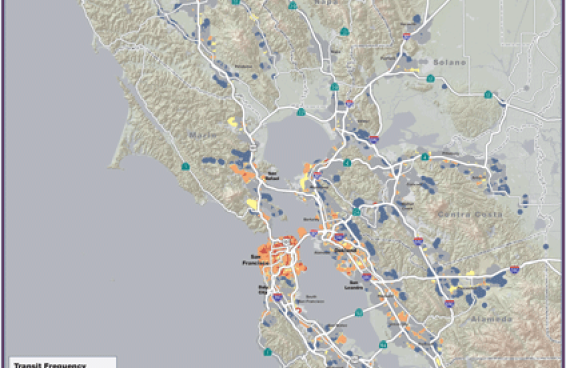
Transit Service Frequency
The map of the month shows the weekday transit service frequency within the Bay Area urban footprint. The transit service frequency was generated based on the rail, ferry and bus service data in MTC's...